
How to Read Your Electric Bill (Line-by-Line Guide for 2026)
Confused by your electric bill? Learn how to read it line by line, understand supply vs delivery, demand charges, and TOU rates—updated for 2026.

Updated for 2026 electricity pricing structures and utility rate plans.
If you’ve ever opened your electric bill and gone straight to the total amount due, you’re not alone.
Most homeowners don’t actually understand their electric bill — not because they’re careless, but because electric bills are written for utilities, not for people. They’re full of unfamiliar terms, small print, and charges that don’t clearly explain why your bill is high or low.
This guide walks through how to read your electric bill line by line, using plain language and realistic examples. By the end, you’ll know what each major section means, which charges actually affect what you pay, and where to focus if you want to lower your bill — without guessing or being sold to.
We’ll cover:
- What your electric bill is really measuring
- The difference between supply and delivery charges
- How demand charges work (and when they apply)
- What time-of-use (TOU) rates mean for your daily habits
You don’t need technical knowledge or math skills. Just a few minutes — and your most recent bill if you have it nearby.
What Your Electric Bill Is Actually Tracking
At its core, your electric bill is a summary of how much electricity your home used over a specific period and how that usage was priced.
The main unit you’ll see is the kilowatt-hour (kWh). A kWh measures energy use over time.
For example:
- Running a 1,000-watt appliance for one hour uses 1 kWh
- Running a 100-watt light bulb for 10 hours also uses 1 kWh
Your bill compares two meter readings:
- A previous reading
- A current reading
The difference between those readings is your total usage for the billing period, usually 28–31 days.
Many bills also show:
- Average daily usage
- A comparison to last month or last year
- Average outdoor temperature
These details are clues. Once you know where to look, they help explain why your bill changed.
The First 3 Lines You Should Look At
Before you look at the dollar amount, there are three lines on your bill that explain most changes in cost.
1. Billing Period
This shows the exact dates your bill covers.
If one bill covers more days than another, it will naturally be higher — even if your daily usage stayed the same. Comparing bills with different lengths often leads to false conclusions.
2. Total kWh Used
This is your actual electricity consumption.
- If your bill is higher and kWh increased, usage is likely the reason.
- If your bill is higher but kWh stayed similar, pricing or rate changes are usually involved.
3. Rate Plan Name
This is one of the most overlooked lines on the bill.
Your rate plan determines:
- Whether you have flat rates or TOU rates
- Whether demand charges apply
- How supply and delivery are calculated
Many homeowners are moved to new rate plans without realizing it.
Why this matters:
These three lines explain why your bill changed before you assume something is wrong.
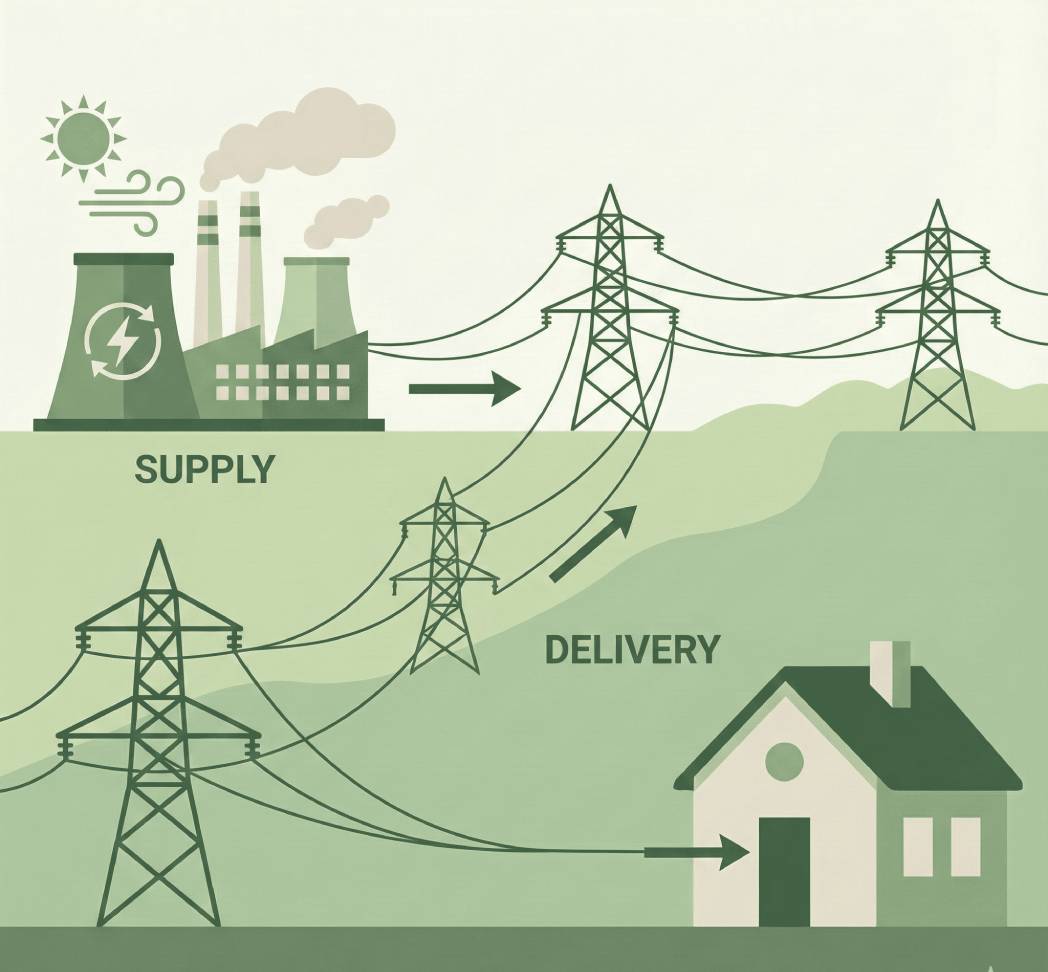
Supply vs Delivery — Why You’re Paying Two Separate Charges
Supply charges pay for the electricity itself, while delivery charges pay for the wires, poles, and grid that bring electricity to your home.
Seeing supply and delivery charges often feels like being charged twice. You’re not.
Think of it this way:
- Supply = the electricity itself
- Delivery = everything required to bring that electricity to your home
Supply charges
Supply covers electricity generation or purchase. This is the part of the bill tied to power plants, fuel costs, and wholesale markets.
In deregulated states, this is sometimes the portion you can shop around for.
Common labels include:
- Generation charge
- Electric supply
- Energy supply service
Supply is almost always priced per kWh.
Delivery charges
Delivery pays for:
- Power lines and poles
- Transformers
- Grid maintenance
- Metering and billing
Delivery is handled by your local utility and is not optional.
This section often includes:
- A fixed monthly fee
- Distribution charges
- Transmission charges
Why this matters:
If most of your bill is delivery-related, cutting usage alone won’t reduce costs as much as you expect.
Demand Charges — Paying for Power Spikes
Demand charges are fees based on the highest amount of power your home uses at one time, not the total electricity used over the month.
Some bills include demand charges, which confuse many homeowners.
Demand charges are based on how much power you use at one moment, not total monthly usage.
kW vs kWh (simple view)
- kWh = total energy used
- kW = how fast you use it
If multiple high-power appliances run at the same time — even briefly — that spike can set your demand charge for the entire month.
Demand charges are more common for:
- Commercial buildings
- Some newer residential plans
- Homes with EV chargers or solar
Why this matters:
A home can use less electricity overall and still have a higher bill due to demand spikes.
Time-of-Use (TOU) Rates — When You Use Power Matters
Time-of-use (TOU) rates charge different prices for electricity depending on the time of day you use it.
Time-of-use pricing charges different rates depending on when electricity is used.
Typical patterns:
- Peak: Late afternoon / evening
- Off-peak: Nights and weekends
- Mid-peak: Shoulder hours
Your bill may split usage into these categories, each with a different price.
Many homeowners see higher bills because:
- Laundry runs after work
- Cooking happens during peak hours
- EVs charge in the evening
Why this matters:
Small habit shifts — not usage cuts — can lower costs on TOU plans.
A Realistic Example Bill, Explained Step by Step
Let’s walk through a simplified but realistic example.
Usage summary
- Billing period: 30 days
- Total usage: 900 kWh
Supply charges
- Rate: $0.11 / kWh
- Cost: 900 × 0.11 = $99.00
Delivery charges
- Fixed service fee: $14.00
- Distribution: 900 × $0.045 = $40.50
- Transmission: 900 × $0.018 = $16.20
Total delivery: $70.70
Demand charge (if applicable)
- Peak demand: 8 kW
- Rate: $6 / kW
- Demand cost: $48.00
Fees & taxes
- Renewable rider: $3.50
- Taxes: $9.80
Total bill
$231.00
What this shows:
Pricing structure matters as much as usage.
How to Spot Errors or Red Flags on Your Bill
Watch for:
- Estimated readings instead of actual
- Sudden usage jumps without explanation
- Rate plan changes you didn’t notice
Comparing the same month year-over-year is often more useful than month-to-month.
What Understanding Your Bill Actually Helps You Do
Understanding your bill helps you:
- Separate usage problems from pricing changes
- Decide which upgrades make sense
- Adjust habits that affect peak or demand charges
- Ask better questions
Most importantly, it removes guesswork.
Frequently Asked Questions
Why is my electric bill high even when I use less electricity?
Because rates, delivery charges, demand fees, or peak-hour pricing may have increased.
What does kWh mean on an electric bill?
A kilowatt-hour (kWh) measures how much electricity you use over time.
Are demand charges common for homes?
They are becoming more common, especially for homes with EV chargers or time-of-use plans.
Can I lower my bill without using less electricity?
Yes. Shifting when you use electricity can reduce costs on time-based pricing plans.
Final Takeaway
Your electric bill isn’t designed to be friendly — but it is designed to be informative.
Once you know how to read it line by line, it becomes a tool instead of a monthly mystery. You’ll know what’s driving your costs, what’s within your control, and where to focus if you want to lower your bill over time.
If you want help applying this to your own home, ZunoEnergy’s free Smart Energy Checkup explains your energy use in plain language — without sales calls or pressure.
Understanding comes first. Everything else follows.
See how this applies to your home.
Stop guessing. Get a personalized breakdown of your energy usage and savings potential in about 2 minutes.
Start Free AnalysisNo account required • 100% Free